On the internet, you see the term Dunning-Kruger effect passed around a lot.
Many people seem to think it describes a phenomenon where – people of lower intelligence tend to overestimate their intelligence, whereas people with higher intelligence tend to underestimate it.
I find it quite ironic that people will confidently accuse someone of exemplifying the ‘Dunning-Kruger effect’ with this meaning in mind, because this isn’t the Dunning-Kruger effect. When referring to intelligence/IQ, the term Downing effect is used.
What actually is the Dunning-Kruger effect?
In reality, the effect is defined as something along the lines of:
A cognitive bias whereby people with low ability in a specific domain or skill, tend to overestimate their competence.
The Dunning-Kruger effect requires the context of a specific domain or skill, which is what most people miss.
Admittedly, it is quite similar to the Downing effect. It is also similar in the quality of high-ability people having a tendency to underestimate their competence.
Another misconception
If you search for Dunning-Kruger in any search engine and go onto images, you will undoubtedly find graphs akin to the one drawn below.
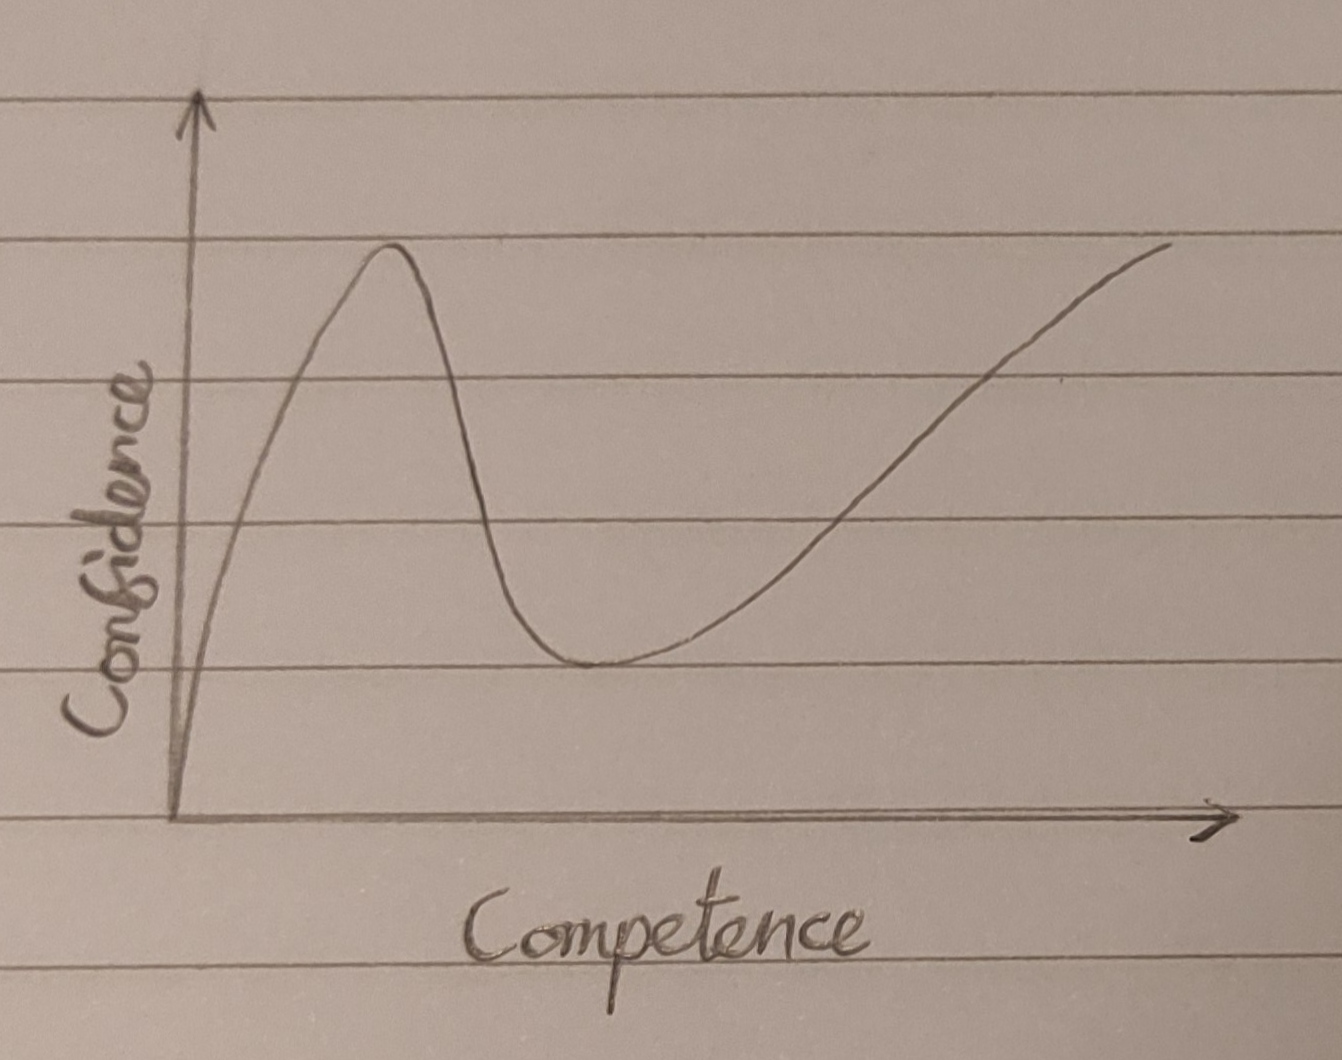
⚠️🚨 This graph is completely WRONG. 🚨⚠️
These kinds of graphs seem to be saying that the most confident people are the very beginners, and that past a point of peak confidence, there is a huge dip. I am not quite sure where this graph originates from, but it is definitely not true to Kruger and Dunning’s findings (the people who first identified the effect).
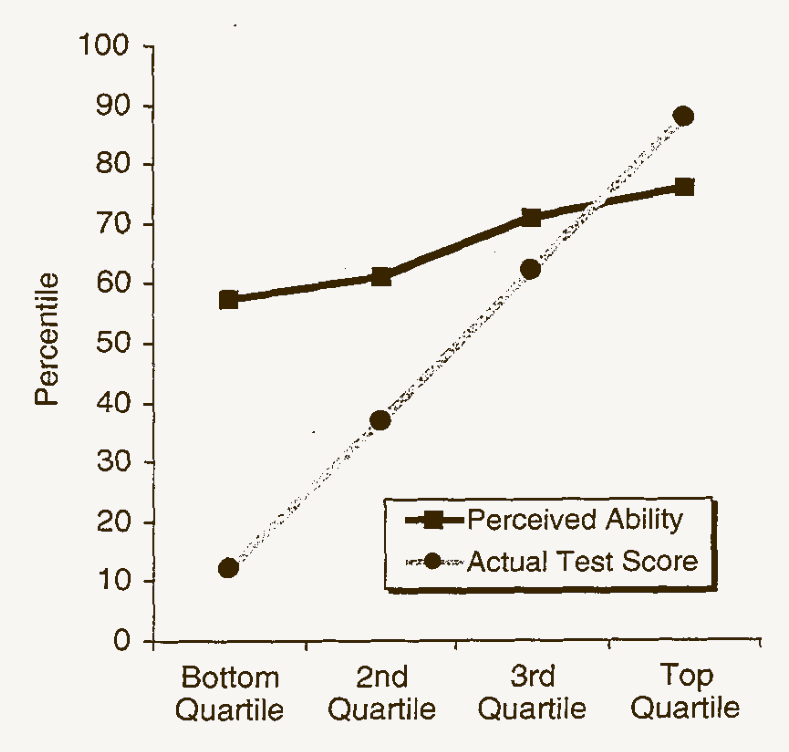
The figure above is the result of one of 4 experiments from the original study. The other experiments do yield fairly different results, but still align with what I’m going to say.
We can see in the figure that the bottom quartile overestimates its ability the most. As we go up the quartiles the overestimation decreases and crosses into underestimation with the top quartile. This is what the Dunning-Kruger effect describes. However, if we look at the perceived ability in isolation, we can still see it generally increasing with actual ability. There is no magical dip in the second quartile like the fake graphs would suggest.
Why does the Dunning-Kruger effect occur?
Although there is no definite or universally accepted explanation, I will explain the 2 most popular models.
Metacognitive
The idea behind this explanation is that people with a low skill level are less able to accurately assess their own performance. This is because part of getting better at a skill includes the ability to distinguish between good and bad performance, so amateurs of a skill won’t have much experience in this.
Since they are less able to assess their performance, and due to natural self-favouring skew, people are unaware of their flaws and rate themselves as having higher competence than they actually do.
On the other hand, people with average or high competence, are able to see their flaws and rate themselves (relatively) lower.
Statistical
This model basically denies that the Dunning-Kruger effect is a cognitive bias. Instead it argues that it is a statistical artifact, and that the findings of studies can be explained by regression toward the mean and the better-than-average effect.
‘Regression toward the mean’ describes a tendency for predicted or repeated values to be closer to the mean than extreme observations. In Dunning-Kruger effect studies, the data tends to be modelled via linear regression, so we will see how ‘regression toward the mean’ applies to this.
If the sample correlation coefficient is not perfect, we will find that the predicted variable (self-assessed performance) will be closer to its mean than the independent variable (the actual performance).
This results in a shallower slope when plotting self-assessed performance against actual performance.
The ‘better-than-average effect’ describes how people tend to believe they are above average in certain situations. This lifts the mean value of the self-assessed performance for many Dunning-Kruger effect studies.
These 2 effects (shallower slope and elevated mean) can reasonably explain the results we see in Dunning-Kruger effect studies (and can also explain other effects such as the Downing effect).
Some people argue that the Dunning-Kruger effect is described entirely by this statistical model, and that it has nothing to do with the ability to self-assess performance. However, realistically the metacognitive element still plays a role.
Conclusion
Don’t use the term Dunning-Kruger effect, it makes you sound pretentious.
Sources
- Justin Kruger and David Dunning (Original 1999 Study)
- Wikipedia – Dunning-Kruger effect
- Wikipedia – Illusory superiority
- Graph Paper Diaries – The Real Dunning-Kruger Graph